Executive summary
Release content
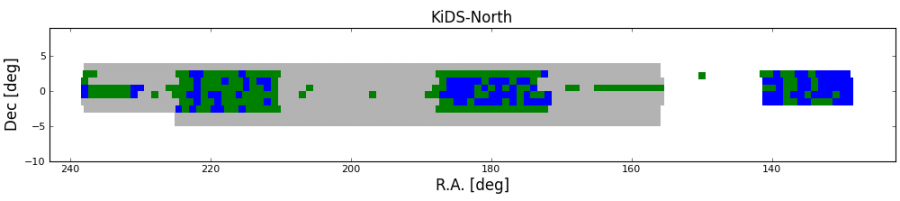
The third public data release of KiDS consists of coadds, weight frames, masks and single-band source lists for 292 survey tiles, and a multi-band catalog for the combined 440 tiles for DR1, DR2 and DR3, now including GAaP photometry, color calibration, homogenized zeropoints where possible, and photometric redshifts. A sky view of the locations of the included tiles is shown in Fig. 1, and the coordinates of the tiles included in the image release and the catalog are listed in the tile table and catalog table, respectively.
|
|
Figure 1: Location of the 148 KiDS-ESO-DR1/DR2 tiles (blue) and the 292 KiDS-ESO-DR3 tiles (green); the KiDS survey area (top: KiDS-North; bottom: KiDS-South) is outlined in grey. |
Intrinsic data quality
|
|
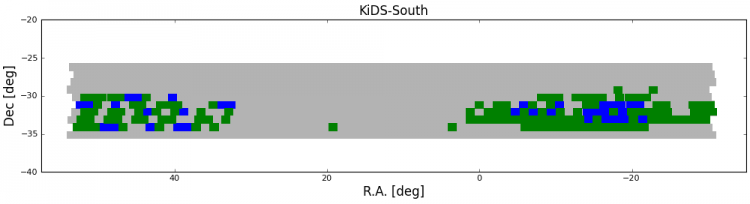
Figure 2: Raw data quality parameters for KiDS-ESO-DR1, -DR2 and -DR3. The light coloured portions of the histograms correspond to the 148 tiles in KiDS-ESO-DR1 and -DR2, and the dark coloured portions to the 292 tiles newly released in KiDS-ESO-DR3; the multi-band catalogue combines all 440 tiles and therefore corresponds to the total histograms. Left: average PSF size (FWHM) distributions; centre: average ellipticity distributions; right: limiting magnitude distributions (5σ AB in 2'' aperture). The distributions are per filter: from top to bottom u, g, r, and i, respectively. |
Photometric quality
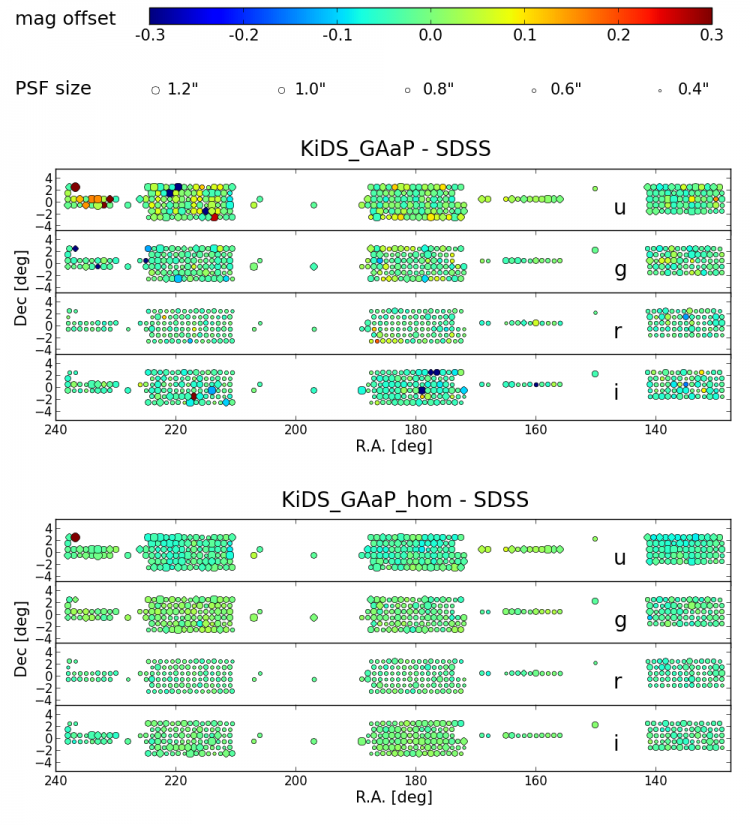
The photometric quality of KiDS DR3 is assessed by comparing stellar magnitudes to SDSS DR8, both for GAaP magnitudes and for 10'' corrected aperture magnitudes, and with and without photometric homogenization.
Table 1 lists the average per-tile offsets and the standard deviations for each filter, as well as for three "principal colors" that align with the stellar locus (Ivezić et al. 2004, AN, 325, 583).
Figure 3 shows the mean offsets for the GAaP photometry before and after homogenization.
Since the calibration of KiDS-South follows the same procedures as KiDS-North, the photometric quality is expected to be comparable.
| Filter / Color | Standard calibration | Homogenized calibration | ||||||
|---|---|---|---|---|---|---|---|---|
| Mean offset | Std.dev | Mean offset | Std.dev | |||||
| GAaP | Ap.cor | GAaP | Ap.cor | GAaP | Ap.cor | GAaP | Ap.cor | |
| u | 0.002 | 0.051 | 0.074 | 0.075 | -0.031 | 0.018 | 0.033 | 0.036 |
| g | -0.025 | 0.017 | 0.074 | 0.074 | -0.009 | 0.034 | 0.024 | 0.029 |
| r | -0.022 | 0.016 | 0.031 | 0.029 | -0.025 | 0.012 | 0.015 | 0.018 |
| i | -0.037 | 0.015 | 0.057 | 0.055 | -0.016 | 0.036 | 0.018 | 0.029 |
| s | -0.001 | -0.002 | 0.057 | 0.057 | 0.014 | 0.013 | 0.017 | 0.023 |
| w | 0.014 | 0.007 | 0.041 | 0.039 | -0.002 | -0.009 | 0.004 | 0.018 |
| x | -0.009 | -0.006 | 0.052 | 0.051 | -0.001 | 0.002 | 0.008 | 0.017 |
Table 1: Per-tile photometric offsets between KiDS GAaP photometry and SDSS DR8 PSFmag photometry for the four filters and three "principal colours" that align with the stellar locus.
|
|
Figure 3: Photometric calibration and PSF sizes in KiDS-North. Average magnitude offsets for KiDS-ESO-DR3 tiles between KiDS GAaP magnitudes and SDSS DR8 PSF magnitudes of stars are indicated by the colour coding, while the symbol size corresponds to the average PSF size. Top: magnitude offsets without photometric homogenization. Bottom: magnitude offsets after applying the zero-point corrections from the photometric homogenization. |
Photometric redshifts
Note: the multi-band catalog delivered to ESO includes photometric redshifts based on the bayesian SED-fitting method BPZ; photo-z's based on the machine learning method MPLQNA are delivered separately via this website.
|
|
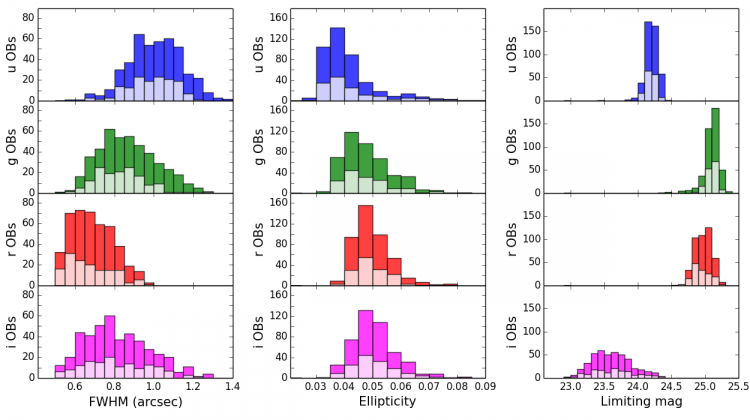
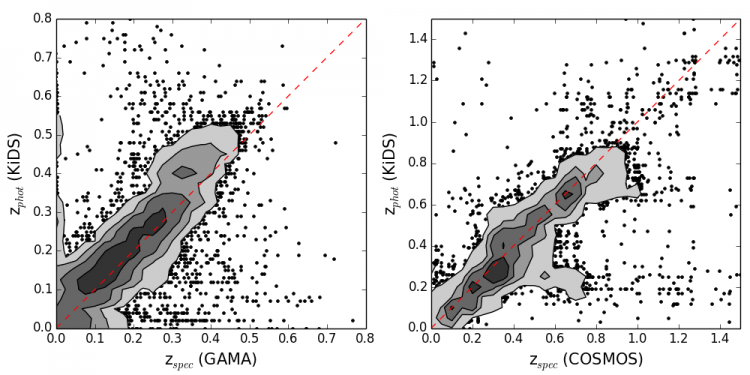
Figure 4: KiDS BPZ photometric redshifts vs. GAMA (left) and COSMOS (right) spectroscopic redshifts. Galaxies are represented by points, which are replaced by contours in the crowded regions of the plots. Unflagged and unmasked galaxies with r<23 were characterized by the relative error Δz = (zB - zspec)/(1 + zspec), where zB is the best-fitting redshift from BPZ. The comparison with GAMA, mostly restricted to z<0.5, yields an outlier rate (here defined as |Δz| > 0.15) of 1.5%, and after removing these outliers a photo-z bias of 0.02 and scatter of 0.03. Extending to much higher redshifts, the comparison with COSMOS gives an outlier rate of 8.3%, and a photo-z bias and scatter of -0.01 and 0.05, after removal of outliers. |