KiDS Data Release 5
Welcome to the webpages dedicated to the fifth public data release by the Kilo-Degree Survey (KiDS). KiDS is an ESO public survey carried out with the VLT Survey Telescope (VST) and OmegaCAM camera, that has imaged 1347 square degrees in four filters (u, g, r, i). Single epoch observations are provided in (u, g, r). Multi-epoch imaging is provided in the i-band, with the two observations, denoted i1 and i2, typically separated by several years. KiDS was designed as a weak lensing tomography survey, with a core science driver to map and constrain the properties of the evolving large-scale matter distribution in the Universe. The median r-band 5σ limiting magnitude is 24.8 with median seeing 0.7''. Additional science cases are manifold, ranging from galaxy evolution to Milky Way structure, and from the detection of white dwarfs to high-redshift quasars.
Data access is provided via the ESO science archive, Astro-WISE and via this website (see the 'Data access' link to the left).
Please see the Acknowledgments page for how to acknowledge
use of data from this release.
KiDS DR5 contents
This fifth data release (KiDS-ESO-DR5) consists of:
- u,g,r,i1 and i2 calibrated, stacked images and their weights, as well as masks and single-band source lists for 1347 survey tiles.
- a multi-band ugri1i2ZYJHKs source catalog incorporating near-IR photometry from the companion VIKING survey (Edge et al., 2013) with VISTA. This catalogue encompasses the combined 1347 square degree area of this data release, with PSF-homogenised and aperture-matched photometry, and derived photometric redshift and stellar mass estimates.
- separate calibrated, stacked r-band images and their weights based on a lensing optimized reduction with the THELI pipeline used for source detection for the multi-band catalog.
Full resolution Hierarchical Progressive Surveys (HiPS) zoomable colour images of the KiDS-ESO-DR5
VST data can be viewed at the following addresses as well as in the Aladin sky viewer and other
HiPS-aware clients:
→ https://alasky.cds.unistra.fr/KiDS/CDS_P_KiDS_DR5_color-gri/ (g/r/i)
→ https://alasky.cds.unistra.fr/KiDS/CDS_P_KiDS_DR5_color-ug/ (u/u+g/g)
|
|
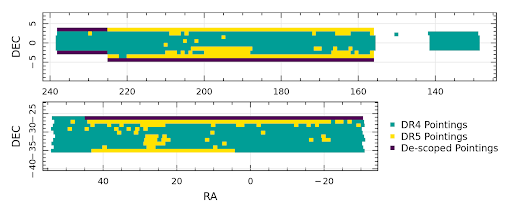
Figure 1: Location of the 1347 KiDS-ESO-DR5 tiles. The area covered in DR4 is shown in green, while the yellow tiles are new additions. Pointings that were descoped from the original 1500 deg2 KiDS footprint due to the limited area observed by VIKING, are shown in dark purple (top: KiDS-North; bottom: KiDS-South). |
Intrinsic data quality
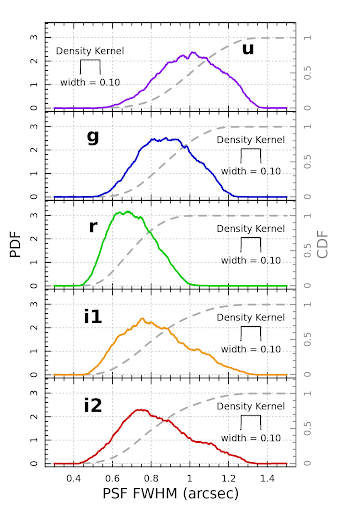
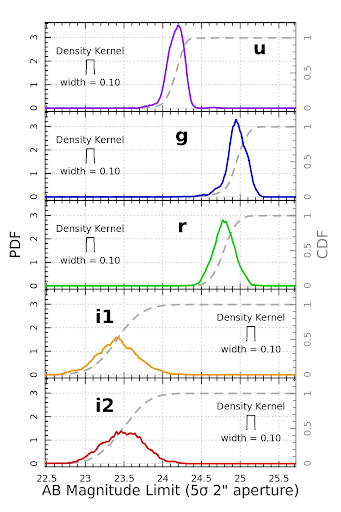
The intrinsic data quality is illustrated by the obtained seeing (FWHM) and limiting magnitude (5σ AB in 2'' aperture) distributions per filter in Figure 2. In the case of filters observed during dark time (u, g, r), the FWHM distributions reflect the different observing constraints, with r-band taking the best conditions. As the i-band is the only filter observed in bright time, we recover a large range of seeing conditions in this filter. The wide range of i-band limiting magnitudes is caused by the larger range in seeing and moon phase and thus sky brightness. We note that the second-pass i-band imaging does not suffer from the poor baffling of the VST in the period up to May 2015 that particularly affected the i-band sky background.
|
|
|
Figure 2: Tile-by-tile raw data quality parameters for KiDS-ESO-DR5. Left: average PSF size (FWHM) distributions; right: limiting magnitude distributions (5σ AB in 2'' aperture). The distributions are per filter: from top to bottom u, g, r, and then the multi-epoch i1 and i2 bands. | |
Photometric calibration
The absolute calibration of the KiDS optical photometry is tied to the SDSS photometric system using Stellar Locus
Regression between the optical filters and Gaia broad-band photometry (see Wright et al. (2024, A&A 686, 170)
for details).
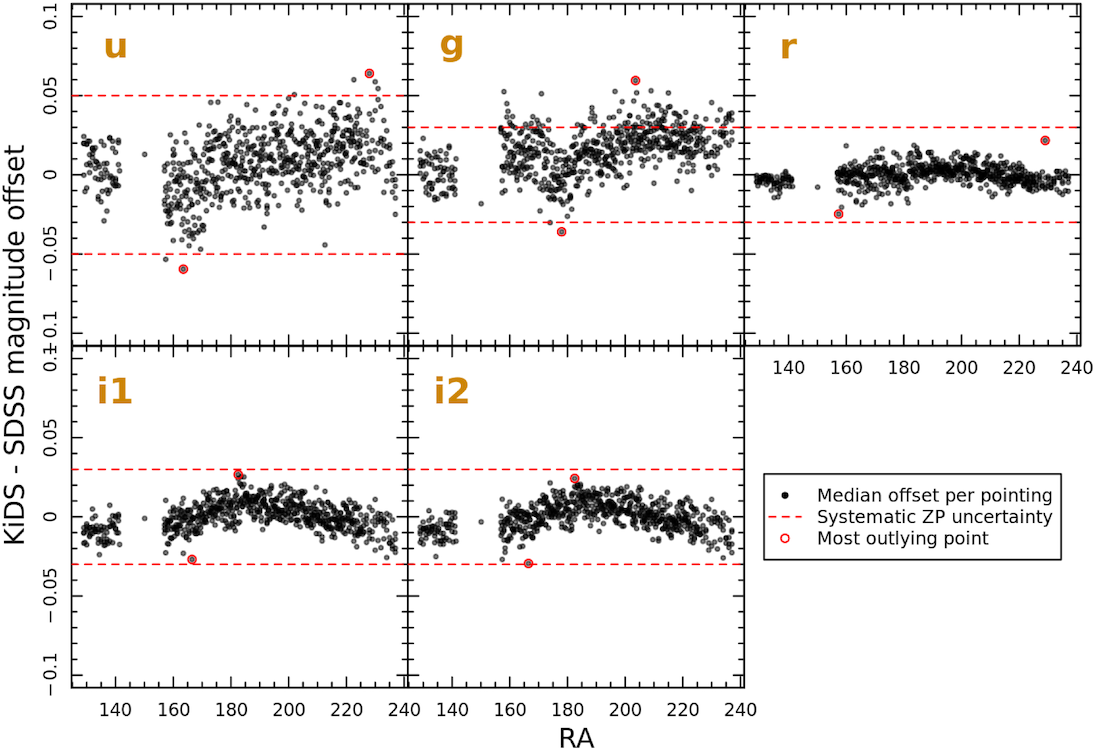
The resulting calibration is very stable, as demonstrated by the comparison of KiDS-North tiles to SDSS photometry in Figure 3.
|
|
Figure 3: Distribution of the median photometric offsets between stars in KiDS-ESO-DR5 tiles (in the magnitude range 16.5 < r < 19) and their counterparts from SDSS imaging for tiles with >10% unmasked data. The horizontal dashed lines represent the systematic zero-point uncertainty that captures any residual systematic variation in the photometry. |