Data Quality
Image data quality
All KiDS observations are queue-scheduled and matched to the seeing distribution at Paranal, with the best dark conditions used for r-band. The exposure times and observing constraints for all filters are listed in the table below.
| Filter | Max. FLI | Min. moon distance | Max. seeing (arcsec) | Max. airmass | Sky transp. | Dithers | Total Exp. time (s) |
|---|---|---|---|---|---|---|---|
| u | 0.4 | 90 | 1.1 | 1.2 | CLEAR | 4 | 1000 |
| g | 0.4 | 80 | 0.9 | 1.6 | CLEAR | 5 | 900 |
| r | 0.4 | 60 | 0.8 | 1.3 | CLEAR | 5 | 1800 |
| i | 1.0 | 60 | 1.1 | 2.0 | CLEAR | 5 | 1080 |
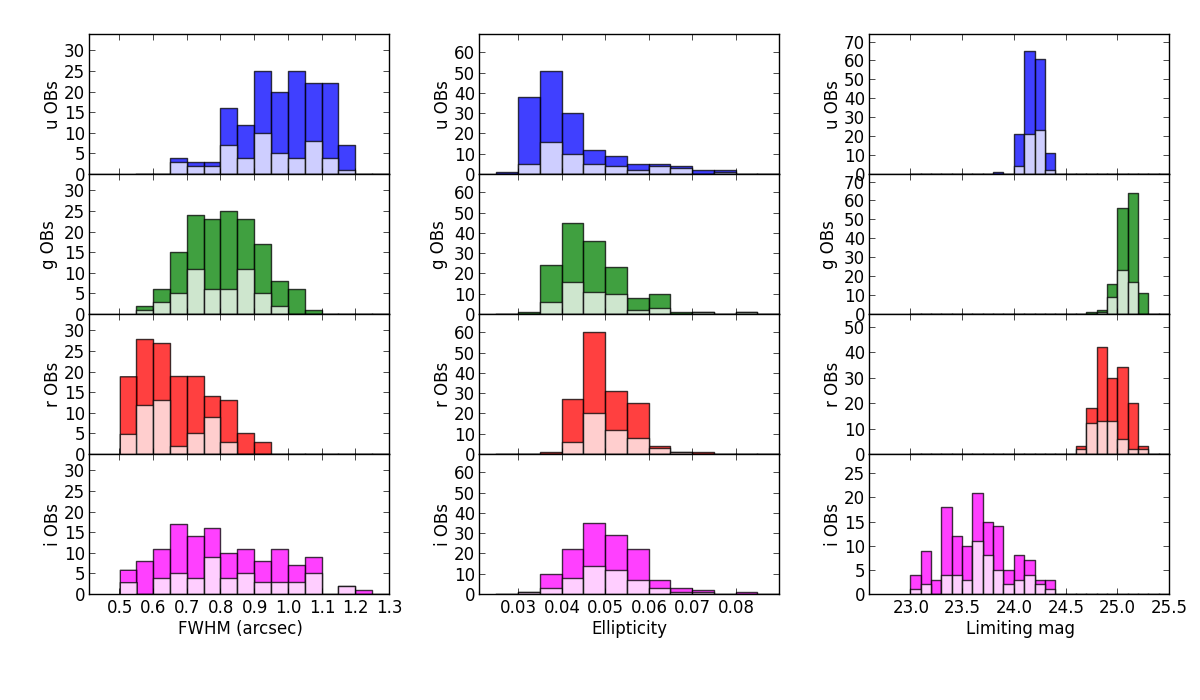
The following figure shows for each filter the obtained PSF size (FWHM), PSF ellipticity, and limiting magnitudes (5 σ AB in 2'' aperture) distributions for the data included in the multi-band catalog, split up into the tiles released in KiDS-ESO-DR1 and KiDS-ESO-DR2. The seeing constraints for the filters observed in dark time (u, g, r) are reflected in the relatively narrow PSF size distributions, while the distribution in i-band is much broader since it is the only filter observed under bright conditions. Average ellipticities, taken as the average absolute amount of ellipticity regardless of angle, are always less than 10%. The wide range of limiting magnitudes in i-band is due to the large range in moon phase and sky brightness.
As for the imaging products the overall image quality is best in r-band. For this reason the r-band data were used for the object detection for the catalogue. Subsequently, SExtractor was run in double-image mode to measure source parameters in the other filters. The star-galaxy classification included in the catalogue is also based on the r-band data.
|
|
Raw data quality parameters for KiDS-ESO-DR1 and KiDS-ESO-DR2. The white portions of the histograms correspond to the 50 tiles in KiDS-ESO-DR1 and the colored portions to the 98 tiles newly released in KiDS-ESO-DR2; the multi-band catalog combines all 148 tiles and therefore corresponds to the total histograms. Left: average PSF size (FWHM) distributions; center: average ellipticity distributions; right: limiting magnitude distributions (5σ AB in 2'' aperture). The distributions are per filter: from top to bottom u, g, r, and i, respectively. |
Data product quality
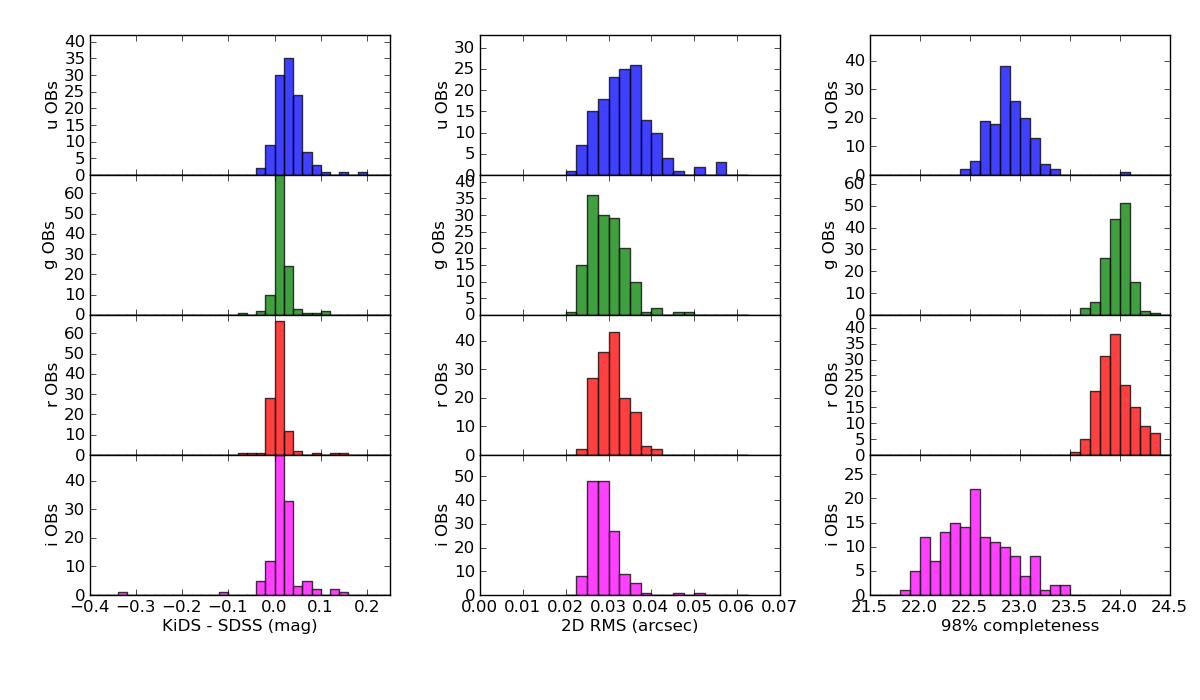
The photometry provided in this data release is in the instrumental system, which is very close to the SDSS photometric system; the color terms can be found on the photometric calibration page. Comparison of stellar photometry to SDSS shows that within a coadded image, the photometry is flat to within a few percent. The distribution of the absolute photometric offset between the multi-band catalog provided in KiDS-ESO-DR2 and SDSS for the tiles in KiDS-North is shown in the figure below (left). There is a small number of outliers, caused by non-photometric conditions or lack of good SA observations for the night. Corrections for both become possible in future releases with significant contiguous area, which will allow a global calibration for the entire survey. For more details see the photometric calibration page.
The accuracy of the absolute astrometry ("KiDS vs 2MASS") is uniform over a coadd, with typical 2-dimensional RMS of 0.31 arcsec in g, r, and i, and 0.25 arcsec in u. The relative astrometry ("KiDS vs KiDS"), measured from the 2-dimensional astrometric residuals between dithers, is approximately 0.03''; distributions are shown in the figure below (center). Details on the astrometric calibration are available on the astrometric calibration page.
The source lists provided in KiDS-ESO-DR2 are intended to be as complete as possible, and provide 98% completeness limits as shown in the figure below (right). More details on the source detection, completeness and spurious source fraction can also be found on the source lists page.
|
|
Photometric, astrometric and completeness overview of KiDS-ESO-DR1 and KiDS-ESO-DR2 (all data contained in the multi-band catalog). Left: median photometric offsets for stars between the tiles in KiDS-North and SDSS DR8. Center: median relative astrometric offsets between the dithers in a coadd. Right: 98% completeness magnitude distributions for all tiles. In all columns the panels correspond to u, g, r, and i from top to bottom. |
Data foibles
Scattered light and reflections
Some of the main issues in the early VST/OmegaCAM data are related to scattered light and reflections. Due to the open structure of the telescope, light from sources outside the field-of-view is often affecting the observations. This expresses itself in a number of ways:
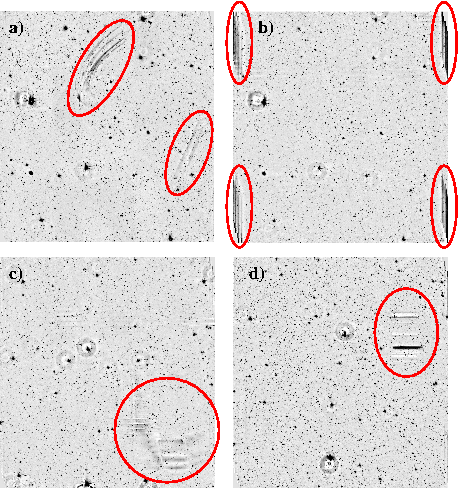
- reflections: in some cases strong reflected light patterns are seen in the focal plane; these are caused by light from bright point sources outside the field-of-view and can occur in all filters. Some examples are shown in panel a) below.
- vignetting by CCD masks: vignetting and scattering by the masks present at the corners of the focal plane array, and at the gaps between the rows of CCDs; this effect is particularly strong in i-band due to the bright conditions. The effect near the CCD gaps is largely corrected for, but in many cases the areas in the corners of the CCD array is strongly affected. Examples are shown in panel b) below.
- extended background artifacts: related to the reflections mentioned before, this is mostly seen in i-band and probably caused by moonlight. An example is shown in panel c) below.
Most of these effects are not (yet) corrected for in the current data processing, but
strongly affected regions are included in the image masks provided in this data release
and affected sources are flagged in the source lists.
Improvements to the telescope baffles that were installed in 2014 significantly improve scattered light suppression.
Individual CCD issues
There are two issues related to individual CCDs that noticeably affect this data delivery:
- CCD 82: this CCD suffered from random gain jumps and related artifacts until its video board was replaced on June 2 2012. Artefacts as shown in panel d) i the figure below are sometimes visible in the image stacks due to this problem. Photometry in this CCD can be used due to the cross-calibration with neighbouring CCDs in the dithered exposures, but part of the CCD is lost. These features are included in the image masks and affected sources are flagged.
- CCD 93: during a few nights in September 2011 (Early Science Time) one CCD was effectively dead due to a video cable problem. One observation included in this data delivery (the multi-band source catalog) does not include this CCD: the i-band observation of KIDS_341.2_-32.1.
|
|
Examples of known issues in the VST/OmegaCAM data, highlighted by the red ellipses. a) light patterns caused by reflections and scattered light of bright sources outside the FOV. b) vignetting and scattering by CCD masks at the corners of the CCD array. c) extended background structures caused by scattering of moonlight. d) patterns caused by defective video board of CCD 82. |